A scanning electron microscope (SEM) equipped with energy-dispersive X-ray spectroscopy (EDX) enables surface observation at the nanometer to micrometer scale, together with elemental analysis.
We use this equipment to examine the morphology of plating deposits and investigate defects. It is an essential analytical tool for our plating work. In this article, we introduce examples of how we use SEM and EDX for analysis.
When we look at an object, light reflected from its surface reaches the retina. The brain processes these signals to form an image.
An SEM directs an electron beam onto a sample and detects secondary electrons and backscattered electrons from the sample. These signals are processed to form an image. Because electrons have a much shorter wavelength than visible light, an SEM can produce highly detailed images at the nanometer scale.
The electron beam also causes the sample to emit characteristic X-rays. Analyzing these X-rays reveals which elements are present. This is elemental analysis using EDX.
High Magnification Imaging
An SEM can capture images at much higher magnifications than an optical microscope or a digital microscope, allowing us to observe plating features that are invisible to the naked eye.
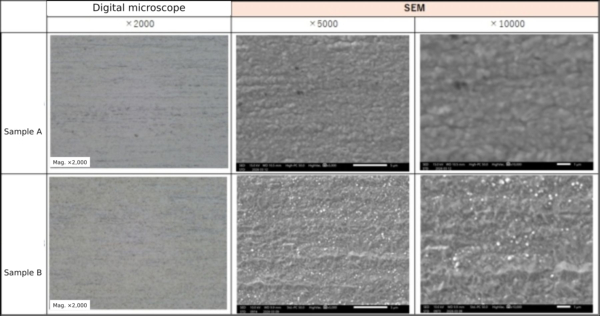
The images below show the surfaces of two nickel-plated samples. The digital microscope images reveal little difference between the samples, while the SEM images show small white particles on Sample B.
Observation at magnifications of 5,000× and 10,000× reveals subtle differences in the morphology of plating deposits. Differences in morphology can sometimes account for uneven appearance or variations in color.
EDX can identify the elements present in a sample. For example, when foreign material is found on a surface, EDX can be used to determine its elemental composition.
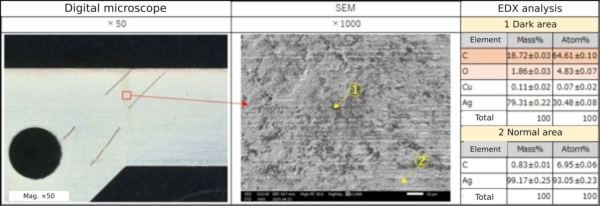
The images below show an analysis of an area of silver plating that had turned brownish. The discolored area appeared dark in the SEM image. Elemental analysis detected more carbon (C) and oxygen (O) than in the unaffected area, where no contamination was visible.
The higher carbon content suggests that organic contamination, such as oil, had adhered to the surface and caused the discoloration.
EDX results can also be displayed using a different color for each element, showing where the elements are distributed. This is called elemental mapping.
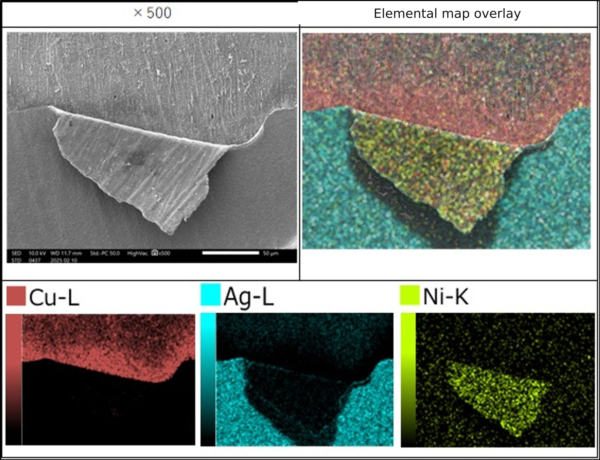
The image below shows elemental mapping of an area with peeling. The product has a copper substrate, nickel underplating, and a silver top layer. An SEM image alone does not identify the elements present, but assigning colors to the elements makes it easier to determine the interface at which peeling occurred.
In this example, peeling occurred between the copper substrate and the nickel layer. Inadequate pretreatment may have resulted in poor adhesion of the nickel plating.
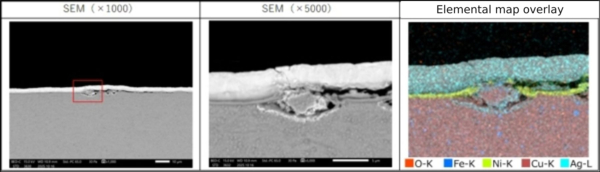
Elemental mapping is also frequently used for cross-sectional observation. It reveals the plating layers and helps us investigate peeling and blistering. The image below shows a cross section through a blister.
A lump-like mass of copper is present in the blistered area, with a small gap between it and the substrate. Plating solution or rinse water may have entered this gap and seeped out during a later process, interfering with deposition and resulting in poorly adherent plating that subsequently blistered.
In this article, we introduced examples of analysis using SEM and EDX.
When a defect occurs, we first examine the affected area in detail. SEM and EDX provide information that cannot be obtained through visual inspection or conventional microscopy alone. We use these findings to investigate the cause of the defect and develop countermeasures.
SEM and EDX are also useful for developing new plating coatings. By developing deposits with different morphologies, we can create surface structures that provide new functional properties.
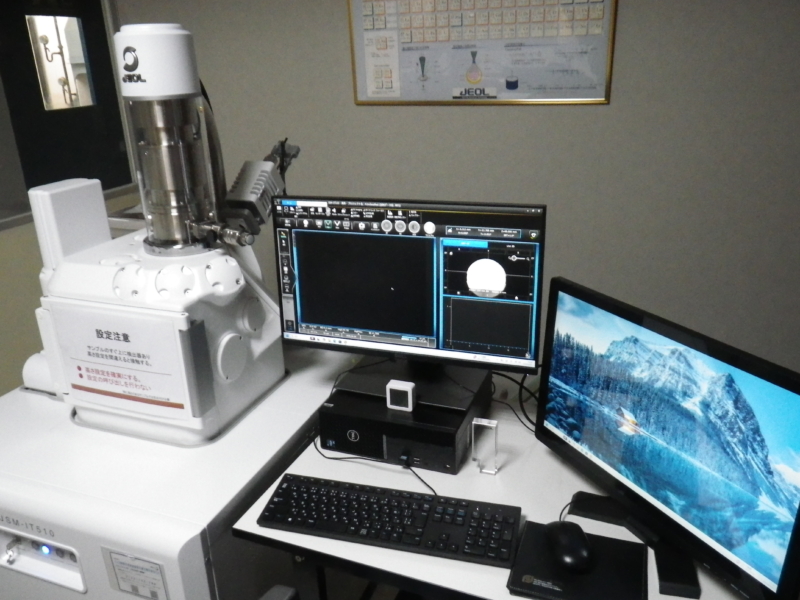
The scanning electron microscope used at METEK is the JSM-IT510.